


In the fascinating world of mathematics, there are concepts that seem simple yet are often misunderstood. One such topic is the idea of proportions, specifically direct and inverse proportions. Through the lens of graphs, we can decode these relationships more intuitively. So, when we question, “Which is not true about a direct proportion?”, we dive into an exciting exploration that brings clarity to many students and educators.
What are Directly Proportional Graphs / Inversely Proportional Graphs?
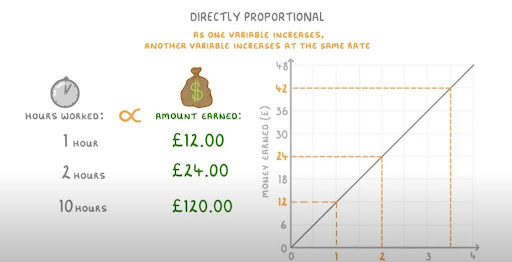
Directly Proportional Graphs
An increase in one variable results in an increase in the other variable that is directly proportionate to the initial increase. To put it another way, if one number doubles, the other number does too, and if one number triples, the other number does too. Linear relationships, depicted by straight lines that start and end at (0,0) on a Cartesian plane, are typical of these graphs.
A mathematical expression for a 1:1 relationship looks like this:
- y = kx
Where:
- y is the dependent variable.
- x is the independent variable.
- k is a constant that represents the proportionality factor.
In this equation, as x increases, y increases, and the ratio y/x remains constant, equal to k.
Here’s a table to illustrate a directly proportional relationship:
| x | y | y/x (k) |
| 1 | 2 | 2 |
| 2 | 4 | 2 |
| 3 | 6 | 2 |
| 4 | 8 | 2 |
As you can see, the ratio y/x remains constant at k = 2 for all data points, demonstrating direct proportionality.
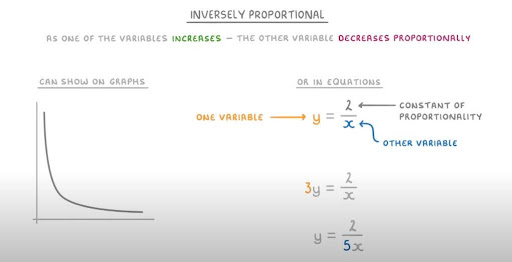
Inversely Proportional Graphs
However, with inversely proportional graphs, the increase in one variable is mirrored by a reduction in the other variable, and vice versa. When one variable doubles, the other one halves, and when one variable triples, the other one is decreased by a third. When plotted on a Cartesian plane, these graphs frequently take on a hyperbolic form.
An inverse proportional relationship can be represented by the following equation in mathematics:
- xy = k
Alternatively, it can be expressed as:
- y = k/x
Where:
- y is the dependent variable.
- x is the independent variable.
- k is a constant representing the proportionality factor.
In this equation, as x increases, y decreases, and the product xy remains constant, equal to k.
Here’s a table to illustrate an inversely proportional relationship:
| x | y | xy (k) |
| 1 | 2 | 2 |
| 2 | 1 | 2 |
| 3 | 2/3 | 2 |
| 4 | 1/2 | 2 |
As you can see, the product xy remains constant at k = 2 for all data points, demonstrating inverse proportionality.
How to Use Directly Proportional Graphs / Inversely Proportional Graphs
Two common types of relationships you may encounter in graphs are directly proportional and inversely proportional. Let’s explore how to use and interpret these types of graphs, providing you with a comprehensive understanding of their characteristics and applications.
Directly Proportional Graphs
Directly proportional graphs represent a relationship in which two variables increase or decrease together in a consistent manner. In other words, as one variable increases, the other also increases, and vice versa. Here’s how to recognize and utilize directly proportional graphs effectively:
- Linearity and Origin Pass-through: Directly proportional graphs are characterized by a straight line that passes through the origin (0,0) on the coordinate plane. This means that when both variables are zero, the graph intersects at the origin.
- Gradient or Slope: The gradient or slope of the line on a directly proportional graph provides essential information about the relationship. It represents the constant of proportionality. You can calculate the slope by choosing two points on the graph and applying the following formula:
Slope (m) = (Change in y) / (Change in x)
Example:
Consider the relationship between time (x-axis) and distance traveled (y-axis) for a car moving at a constant speed. The graph will be a straight line passing through the origin, and the slope of the line will represent the speed of the car.
| Time (hours) | Distance (miles) |
| 0 | 0 |
| 1 | 50 |
| 2 | 100 |
| 3 | 150 |
In this example, the graph of time vs. distance is directly proportional, and the slope is 50 miles per hour, indicating a constant speed.
Inversely Proportional Graphs
Inversely proportional graphs represent a relationship in which one variable increases while the other decreases, or vice versa, in a consistent manner. Here’s how to recognize and interpret inversely proportional graphs:
- Characteristic Curve: Inversely proportional graphs do not form a straight line. Instead, they exhibit a characteristic curve that indicates the inverse relationship between the variables.
- Steepness or Flatness: The steepness or flatness of the curve provides insights into the strength of the inverse relationship. A steeper curve indicates a stronger inverse proportionality, while a flatter curve suggests a weaker inverse relationship.
Example:
Consider the relationship between the amount of time (x-axis) spent on a task and the completion rate (y-axis). As time spent on the task increases, the completion rate decreases. The graph will be a curve with a steeper decline for a stronger inverse relationship.
| Time (minutes) | Completion Rate (%) |
| 0 | 100 |
| 10 | 90 |
| 20 | 80 |
| 30 | 70 |
In this example, the graph of time vs. completion rate is inversely proportional, and the curve’s steepness reflects the strength of the inverse relationship.
How to Draw a Directly Proportional Graph / Inversely Proportional Graph
Before drawing any graph, it’s essential to set up a coordinate plane. A coordinate plane consists of two perpendicular axes – the x-axis (horizontal) and the y-axis (vertical). The point where these axes intersect is called the origin, usually denoted as (0,0). The x-axis typically represents the independent variable, while the y-axis represents the dependent variable.
Let’s proceed with drawing graphs for directly proportional and inversely proportional relationships.
Drawing a Directly Proportional Graph
A directly proportional relationship means that as one variable increases, the other also increases by a constant factor. This results in a straight line passing through the origin on the graph. Here are the steps:
- Plot Points: Begin by identifying the given values or equation for the directly proportional relationship. Choose a few sets of values for the independent and dependent variables. For example, if you have the equation y = 2x, you can choose values like (1, 2), (2, 4), and (3, 6).
- Ensure Line Passes Through Origin: For directly proportional graphs, it’s crucial that the line passes through the origin (0,0). This is a key characteristic of this type of relationship.
- Draw a Straight Line: Connect the plotted points with a straight line that passes through the origin. Ensure that the line extends beyond the plotted points to indicate the continuation of the relationship.
Here’s an example of a directly proportional graph with the equation y = 2x:
| x | y |
| 0 | 0 |
| 1 | 2 |
| 2 | 4 |
| 3 | 6 |
Drawing an Inversely Proportional Graph
In an inversely proportional relationship, as one variable increases, the other decreases, and the product of the two remains constant. This type of relationship is represented by a hyperbolic curve on the graph. Here are the steps:
- Plot Points: Start by identifying the given values or equation for the inversely proportional relationship. Choose sets of values for the independent and dependent variables. For example, if you have the equation y = 3/x, you can select values like (1, 3), (2, 1.5), and (3, 1).
- Notice the Curve: As you plot the points, observe the curve that forms. In inversely proportional graphs, the curve should be hyperbolic, not linear.
- Smoothly Join Points: Connect the plotted points smoothly to form the hyperbolic curve. Ensure that the curve extends beyond the plotted points to represent the relationship accurately.
Here’s an example of an inversely proportional graph with the equation y = 3/x:
| x | y |
| 1 | 3 |
| 2 | 1.5 |
| 3 | 1 |
Common Misconceptions
Direct proportion is a fundamental concept in mathematics and science that describes the relationship between two variables where one variable increases or decreases in proportion to the other. However, there are several common misconceptions about direct proportion that need to be clarified. In this educational guide, we will debunk these myths and provide a detailed explanation of each misconception.
All Straight-Line Graphs Indicate Direct Proportionality
False! Only those straight lines which pass through the origin show direct proportionality. Direct proportionality is a fundamental concept in mathematics that describes the relationship between two variables where one variable increases or decreases in direct proportion to the other. Graphically, this relationship is often associated with straight-line graphs. However, a common misconception is that all straight-line graphs represent direct proportionality. This is not the case.
The key to identifying direct proportionality in a graph lies in whether the line passes through the origin, which is the point (0,0) on the coordinate plane. In essence, if the line starts at the origin and passes through it, it signifies a direct proportionate relationship. In such cases, as one variable increases, the other does so in a proportional manner.
In contrast, if the straight line on the graph does not pass through the origin, it does not indicate direct proportionality. This means that one variable is not directly proportional to the other, and the relationship between them may be more complex or not linear at all. Therefore, it is essential to understand that only straight lines passing through the origin represent direct proportionality.
Let’s summarize this misconception:
| Type of Graph | Represents Direct Proportionality? |
| Straight Line Through 0 | Yes |
| Straight Line Not Through 0 | No |
Understanding this distinction is vital for various applications in science and engineering, where recognizing direct proportionality helps in making accurate predictions and solving problems.
Inversely Proportional Graphs are Always Vertical or Horizontal
Incorrect! They follow a hyperbolic curve. Inversely proportional relationships, also known as inverse proportionality, are often misconceived as always being represented by vertical or horizontal lines on a graph. However, this is an inaccurate assumption. Inverse proportionality is graphically depicted as a hyperbolic curve, not as a straight line.
A hyperbolic curve is characterized by its branches moving away from the origin in opposite directions. As one variable increases, the other decreases in such a way that their product remains constant. This inverse relationship is not linear and does not exhibit the properties of a straight line, either horizontal or vertical.
When two variables are inversely proportional, it means that when one variable increases, the other decreases in such a way that their product remains constant. This relationship is best visualized as a hyperbolic curve on a graph, where the curve never intersects the axes.
Here’s a concise summary of this misconception:
| Type of Graph | Represents Inverse Proportionality? |
| Hyperbolic Curve | Yes |
| Vertical or Horizontal Line | No |
Understanding that inverse proportionality is graphically represented by a hyperbolic curve is crucial, especially in fields such as physics and engineering, where it plays a significant role in describing various natural phenomena.
The Steeper the Directly Proportional Graph, the Weaker the Relationship
This is a misconception. The steepness or gradient actually represents the constant of proportionality. Another common misconception about direct proportionality pertains to the steepness or slope of the graph representing the relationship. Some people mistakenly believe that the steeper the graph, the weaker the relationship between the two variables. This is not accurate; in fact, the steepness of the graph conveys crucial information about the relationship.
In a directly proportional relationship, when one variable increases, the other also increases in proportion, and this proportion is determined by the constant of proportionality (often denoted as ‘k’). This constant signifies how much one variable changes for a unit change in the other. Mathematically, the relationship can be expressed as y = kx, where y and x are the two variables.
The steepness of the graph, which is represented by the slope or gradient, reflects the value of this constant of proportionality (k). A steeper graph indicates a larger value of k, meaning that the variables are changing more rapidly in proportion to each other. Conversely, a less steep graph corresponds to a smaller value of k, signifying a slower change in proportion.
Here’s a summary of this misconception:
| Steepness of Graph | Strength of Relationship |
| Steeper | Stronger |
| Less Steep | Weaker |
Understanding that the steepness of a directly proportional graph is related to the constant of proportionality is crucial for various applications in science, economics, and everyday life, where recognizing and quantifying these relationships is essential for making informed decisions and predictions.
Applications in Real Life
Understanding the concepts of direct and inverse proportions is essential as they have wide-ranging applications in real-life scenarios. These principles help us make sense of how various quantities relate to each other, making abstract ideas more tangible. In this discussion, we’ll explore both direct and inverse proportions with detailed examples and illustrations.
Direct Proportions
Direct proportions occur when two quantities increase or decrease simultaneously. As one variable increases, the other also increases proportionally, and vice versa. Here are some real-life examples:
- Fuel Consumption: This is a classic example of direct proportion. When you drive a vehicle that consumes a specific amount of fuel per mile, the relationship between the miles driven and the fuel consumed is directly proportional. If you double the miles you drive, you will double the amount of fuel used. Consider the following table:
| Miles Driven (in miles) | Fuel Consumed (in gallons) |
| 100 | 5 |
| 200 | 10 |
| 300 | 15 |
Here, the ratio of miles driven to fuel consumed remains constant (100 miles per 5 gallons), illustrating a direct proportion.
- Cooking and Recipes: In the culinary world, recipes often involve direct proportions. If you want to serve double the number of people, you would typically double all the ingredients. For instance, if a recipe calls for 2 cups of flour to make pancakes for 4 people, you’d use 4 cups of flour to serve 8 people.
Inverse Proportions
Inverse proportions occur when one quantity increases as the other decreases, and vice versa, while their product remains constant. Let’s explore some practical applications:
- Speed and Travel Time: The relationship between speed and travel time is inversely proportional, assuming a constant distance. If you drive at double the speed, it will take you half the time to reach your destination. Consider this example:
| Speed (in mph) | Travel Time (in hours) |
| 60 | 2 |
| 120 | 1 |
As the speed doubles from 60 to 120 mph, the travel time is halved from 2 to 1 hour.
- Light Intensity: Inverse proportion is also evident in the field of physics. As you move away from a light source, such as a lamp or a candle, the intensity of light decreases. This relationship can be expressed mathematically as follows:
- Intensity ∝ 1/(Distance)^2
Where “∝” denotes proportionality. As the distance from the light source increases, the intensity of light diminishes, and this decrease follows an inverse square law. This is why objects appear dimmer as they move farther away from a light source.
Tips for Educators and Learners

Mastering the concept of direct and inverse proportionality requires both teaching prowess and eager learning. Here are some tips to enhance this educational journey:
Tips for Educators
Real-World Examples
One of the most effective ways to teach direct and inverse proportionality is by grounding theoretical concepts in real-world examples. This approach helps students relate abstract mathematical principles to practical situations, making the learning experience more engaging and tangible.
| Example | Explanation |
| Direct Proportion: | Explain the concept of direct proportionality by using examples such as time and distance, where the longer you travel, the more time it takes. You can also use the relationship between speed, time, and distance in physics as a real-world application. |
| Inverse Proportion: | For inverse proportionality, consider examples like the relationship between the number of workers and the time it takes to complete a task. As the number of workers increases, the time needed decreases, illustrating the inverse relationship. |
Interactive Learning
Utilize interactive tools and resources to visually demonstrate the relationship between variables in direct and inverse proportionality. Graph plotting software and educational applications can help students grasp these concepts more effectively by providing dynamic visual representations.
| Tool | Explanation |
| Graph Plotting Software: | Use software like Excel or specialized graphing tools to create visual representations of proportional relationships. Show how changing one variable affects the other and explore different scenarios. |
| Interactive Applications: | Explore interactive apps designed for teaching mathematics. These apps often allow students to manipulate variables and observe how changes impact proportionality, promoting a deeper understanding of the concepts. |
Encourage Questions
Create a classroom environment where students feel comfortable asking questions related to direct and inverse proportionality. Encouraging curiosity and inquiry fosters a deeper understanding of the concepts and helps clear any misconceptions.
| Strategies | Explanation |
| Open-Ended Questions: | Pose open-ended questions like “What happens when we increase one variable in a direct proportion?” or “Can you think of real-life situations where inverse proportionality is evident?” These questions promote critical thinking and discussion. |
| Peer Discussions: | Encourage students to discuss and debate concepts related to proportionality with their peers. Peer-to-peer discussions can often lead to valuable insights and clarification of doubts. |
Tips for Learners
Practice Regularly
Consistent practice is key to mastering the nuances of direct and inverse proportionality. Regularly working on problems and exercises helps reinforce your understanding of these mathematical concepts.
| Practice Tips | Explanation |
| Solve Problems: | Work through a variety of problems involving direct and inverse proportionality. Start with basic exercises and gradually progress to more complex scenarios. |
| Practice Sets: | Use practice sets or worksheets that focus specifically on proportionality. These sets often include step-by-step solutions, allowing you to learn from your mistakes. |
Visual Learning
Visual aids can greatly enhance your understanding of proportionality. Create graphs, charts, or use physical objects to visually represent the relationships between variables.
| Visual Learning | Explanation |
| Graphs and Charts: | Draw graphs to illustrate direct and inverse proportionality. Label axes, plot data points, and analyze the resulting graphs to gain insights into the relationships. |
| Physical Models: | In some cases, using physical models or objects can help you grasp proportionality better. For instance, using a seesaw to understand the concept of inverse proportionality can be highly effective. |
Seek Clarifications
Don’t hesitate to seek clarifications when you encounter challenges or have questions about direct and inverse proportionality. Asking questions and resolving misconceptions are crucial steps toward achieving a deeper understanding.
| Seeking Clarifications | Explanation |
| Ask Questions: | Don’t be afraid to ask questions like “What is direct proportionality?” or “Can you explain the concept of inverse proportionality in simpler terms?” Seeking clarifications from educators or peers can provide valuable insights. |
| Online Resources: | Explore online resources, such as educational websites, forums, or video tutorials, to find explanations and examples that resonate with your learning style. Utilize these resources to supplement your understanding. |
Conclusion
Understanding direct and inverse proportions through graphical representations can bring much-needed clarity to these mathematical relationships. One must be cautious, though. The question, “Which is not true about a direct proportion?”, reminds us to be vigilant against misconceptions and to seek accuracy in our mathematical journeys.
FAQs
Which is not true about a direct proportion?
One common myth is that all straight lines represent a direct proportion. However, for it to depict direct proportionality, it must pass through the origin.
Are all linear relationships directly proportional?
No. While all directly proportional relationships are linear, not all linear relationships are directly proportional. For instance, a line that doesn’t pass through the origin represents a linear, but not directly proportional, relationship.
How can I identify an inversely proportional relationship in a graph?
An inversely proportional relationship will have a hyperbolic curve. As one variable increases, the other decreases, creating a unique curve that distinguishes it from linear trends.
Which is not true about the constant in direct proportion?
It’s a myth that the constant of direct proportion (k) always has to be greater than one. In reality, it can be any non-zero number.


+ There are no comments
Add yours